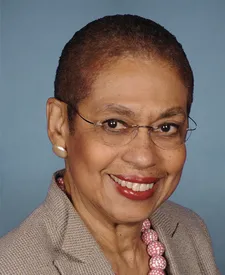
Eleanor Holmes Norton
Democrat · Delegate for the District of Columbia
Career totals · 19 elections · 1990–2026
$5.5 million
raised by Norton’s campaigns, everything from 1990 to 2026 added together.
54%
of it came from organized groups rather than from people giving on their own: at least $3 million from PACs.
$105
was spent about Norton by outside groups. These are ads for or against them that their campaign cannot control, and none of it is part of the money above.
Every number on this page comes from Federal Election Commission filings, read on October 12, 2026. An election still under way keeps raising money, so its figure will have grown since. Check Norton on FEC.gov
Where the money came from
Everything Norton’s campaigns have reported raising, split by who gave it.
- Individual donorsMoney given by people, in their own name.43%$2.3 million
- Political action committeesOrganized groups: company-run committees, unions, trade associations.54%$3 million
- Other sourcesParty transfers, the candidate's own money, loans and smaller categories.3%$160,000
Who gave the most
Committee contributions from the 2024 and 2026 election periods, grouped by how the FEC classifies each giver. This covers a slice of the career total, and giving to a campaign is legal and ordinary.
- Corporation9%$16,000
- Trade association8%$15,000
- Labor union69%$118,000
- Membership organization8%$14,000
- Unclassified6%$9,750
Which industries
- Transport60% · $7,500
- Technology & telecoms40% · $5,000
The FEC records that a committee is a corporation; it does not record its industry. Those labels are ours, kept in a published list anyone can check. Where we have not labeled a giver we say “Other” rather than guessing.
Largest committee givers
- 1Amalgamated Transit Union$11,000
- 2National Association of Realtors$11,000
- 3Unite Here$10,000
- 4International Brotherhood of Electrical Workers$10,000
- 5International Association of Machinists and Aerospace Workers$10,000
Show all 10 giversShow fewer
“Unclassified” means the FEC records no organization type for that committee, which usually means a leadership PAC. We show it as unclassified rather than guessing which industry it belongs to.
Money spent about this member
Outside groups, usually super PACs, may spend without limit on ads for or against a candidate, as long as they do not coordinate with the campaign. Norton has no legal control over any of it.
This is not a donation. Nobody gave this money to Norton. It was spent on advertising about Norton, and money spent against a candidate is plainly not funding them. So it never gets added to the figures above.
$105
has been spent for or against Norton by outside groups. $105 supported Norton; $0 opposed Norton.
Largest outside spenders
Summed across 3 elections, using the Commission's aggregated totals so amended filings and 24-hour notices are not double-counted.
Spent supporting
$105Ads urging people to vote for this member. Still not their money, and they cannot direct how it is spent.
Spent opposing
$0Ads urging people to vote against this member. This money was spent to defeat them.
Nothing on file.
Election by election
The career figures above are the sum of these elections. Each row links to the Commission’s page for that election, where the numbers match line for line.
| Election | Raised | From PACs | Outside spending | |
|---|---|---|---|---|
| 2026in progress | $54,000 | $12,000 22% | none | FEC |
| 2024 | $308,000 | $157,000 51% | none | FEC |
| 2022 | $286,000 | $216,000 75% | $9 | FEC |
| 2020 | $387,000 | $301,000 78% | $60 | FEC |
| 2018 | $420,000 | $317,000 75% | $36 | FEC |
| 2016 | $385,000 | $243,000 63% | none | FEC |
| 2014 | $443,000 | $282,000 64% | none | FEC |
| 2012 | $332,000 | $179,000 54% | none | FEC |
| 2010 | $426,000 | $218,000 51% | none | FEC |
| 2008 | $447,000 | $170,000 38% | none | FEC |
| 2006 | $377,000 | $183,000 49% | none | FEC |
| 2004 | $213,000 | $105,000 49% | none | FEC |
| 2002 | $156,000 | $72,000 46% | none | FEC |
| 2000 | $200,000 | $79,000 40% | none | FEC |
| 1998 | $141,000 | $71,000 50% | none | FEC |
| 1996 | $157,000 | $58,000 37% | none | FEC |
| 1994 | $110,000 | $65,000 59% | none | FEC |
| 1992 | $184,000 | $89,000 48% | none | FEC |
| 1990 | $447,000 | $145,000 32% | none | FEC |
Raised is everything the campaign took in for that election. From PACs is the slice of it given by political action committees. Outside spending is what other groups spent on ads about the race, for and against—it is not part of “Raised”. An election marked in progress is still raising money, so its figures are not final.
We never publish the names of individual donors, and anything we cannot source stays off the page. The methodology explains every such choice.