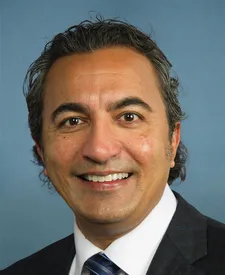
Ami Bera
Democrat · Representative for California’s 6th district
Career totals · 9 elections · 2010–2026
$24 million
raised by Bera’s campaigns, everything from 2010 to 2026 added together.
35%
of it came from organized groups rather than from people giving on their own: at least $8.4 million from PACs, plus donations that organizations collected and directed.
$14.6 million
was spent about Bera by outside groups. These are ads for or against them that their campaign cannot control, and none of it is part of the money above.
Every number on this page comes from Federal Election Commission filings, read on October 12, 2026. An election still under way keeps raising money, so its figure will have grown since. Check Bera on FEC.gov
Where the money came from
Everything Bera’s campaigns have reported raising, split by who gave it.
- Individual donorsMoney given by people, in their own name.61%$14.6 million
- Political action committeesOrganized groups: company-run committees, unions, trade associations.35%$8.3 million
- Other sourcesParty transfers, the candidate's own money, loans and smaller categories.5%$1.1 million
Money bundled through organizations
Not every “individual” donation arrives on its own. An organization can collect checks from its members, already earmarked for Bera, and deliver them in a bundle. The law counts that as individual money, but the organization still chose where it went.
$132,000
reached Bera this way, 1% of everything they raised from individuals. Each donation came from a real person. The organization picked who got it.
- JStreetPAC$72,000
- AIPACThe American Israel Public Affairs Committee's political arm. It backs candidates of both parties it considers strong supporters of the U.S.-Israel relationship.$60,000
We can only count the organizations we have measured, so the real figure could be higher than this, never lower. Bundling is legal and widely used, and appearing here is not evidence of wrongdoing.
Who gave the most
Committee contributions from the 2024 and 2026 election periods, grouped by how the FEC classifies each giver. This covers a slice of the career total, and giving to a campaign is legal and ordinary.
- Corporation40%$590,000
- Trade association21%$313,000
- Labor union4%$66,000
- Membership organization17%$250,000
- Co-operative2%$31,000
- Unclassified15%$225,000
Which industries
- Health & pharmaceuticals56% · $80,000
- Retail & consumer17% · $24,000
- Legal & lobbying14% · $20,000
- Banking & finance14% · $20,000
The FEC records that a committee is a corporation; it does not record its industry. Those labels are ours, kept in a published list anyone can check. Where we have not labeled a giver we say “Other” rather than guessing.
Largest committee givers
- 1International Franchise Association Franchising Political Action Committee Inc$24,000
- 2American College of Surgeons Professional Association PAC$23,000
- 3American College of Physician Services, Inc$20,000
- 4American Academy of Dermatology Association$20,000
- 5American College of Radiology Association$20,000
Show all 10 giversShow fewer
“Unclassified” means the FEC records no organization type for that committee, which usually means a leadership PAC. We show it as unclassified rather than guessing which industry it belongs to.
Their money and their votes, side by side
For each industry that gave to Bera: the money, then the bills they voted on in that industry’s area of law. The Library of Congress assigns each bill’s subject, not us, so nothing here is picked to make a point.
This is not evidence that money bought a vote. People often donate to politicians who already agree with them. We show what was given and how Bera voted; the judgment is yours.
Health & pharmaceuticals—$75,000 given
Bera voted on 5 bills in this area. The 3 most substantive are listed first.
- H R 2493On Motion to Suspend the Rules and PassThis bill reauthorizes through FY2030 grant programs administered by the Health Resources and Services Administration (HRSA) that provide funding to health care service providers and related entities in rural areas.Yes
- H R 2483On PassageSUPPORT for Patients and Communities Reauthorization Act of 2025 This act reauthorizes and revises programs and activities relating to addressing substance use disorders, overdoses, and mental health.Yes
- H R 4541On Motion to Suspend the Rules and Pass, as AmendedThis bill reauthorizes and revises programs of the Centers for Disease Control and Prevention (CDC) that support services and education addressing breast and cervical cancer.Yes
Show 2 more bills with full summariesShow fewer
- H R 6703On PassageLower Health Care Premiums for All Americans ActNo
- H R 498On PassageThis bill prohibits federal Medicaid payment for specified gender transition procedures for individuals under the age of 18. The bill defines these procedures to mean those that are intended to change the body of an individual to no longer correspond to the individual's biological sex (male or female), including specified surgeries, implants, and medications (e.g., hormones).No
We do not score these or say which way a vote favored an industry, because that would be our opinion dressed up as a finding. Each bill links to the chamber’s own roll-call record. Industries where fewer than three bills came to a vote are left out, because a handful of votes cannot show a pattern.
Money spent about this member
Outside groups, usually super PACs, may spend without limit on ads for or against a candidate, as long as they do not coordinate with the campaign. Bera has no legal control over any of it.
This is not a donation. Nobody gave this money to Bera. It was spent on advertising about Bera, and money spent against a candidate is plainly not funding them. So it never gets added to the figures above.
$14.6 million
has been spent for or against Bera by outside groups. $2.5 million supported Bera; $12.1 million opposed Bera.
Largest outside spenders
Summed across 9 elections, using the Commission's aggregated totals so amended filings and 24-hour notices are not double-counted.
Spent supporting
$893,000Ads urging people to vote for this member. Still not their money, and they cannot direct how it is spent.
- Center Forward Committee$360,000
- American Medical Association Political Action Committee$299,000
- American Society of Anesthesiologists Political Action Committee$234,000
Spent opposing
$12 millionAds urging people to vote against this member. This money was spent to defeat them.
- NRCCThe National Republican Congressional Committee, the House Republicans' official campaign organization.$5.5 million
- National Republican Congressional Committee$2.4 million
- Congressional Leadership Fund$1.9 million
- American CrossroadsA long-running Republican super PAC co-founded by strategist Karl Rove.$1.7 million
Show all 5 groupsShow fewer
- US Chamber of Commerce$490,000
Election by election
The career figures above are the sum of these elections. Each row links to the Commission’s page for that election, where the numbers match line for line.
| Election | Raised | From PACs | Outside spending | |
|---|---|---|---|---|
| 2026in progress | $1.3 million | $649,000 52% | $771 | FEC |
| 2024 | $1.3 million | $783,000 63% | $242 | FEC |
| 2022 | $1.5 million | $825,000 53% | $329,000 | FEC |
| 2020 | $1.8 million | $864,000 47% | $8,575 | FEC |
| 2018 | $3 million | $1.2 million 40% | $21,000 | FEC |
| 2016 | $4.2 million | $1.4 million 34% | $4.4 million | FEC |
| 2014 | $4.4 million | $1.4 million 33% | $5.5 million | FEC |
| 2012 | $3.7 million | $703,000 19% | $3.5 million | FEC |
| 2010 | $2.9 million | $432,000 15% | $825,000 | FEC |
Raised is everything the campaign took in for that election. From PACs is the slice of it given by political action committees. Outside spending is what other groups spent on ads about the race, for and against—it is not part of “Raised”. An election marked in progress is still raising money, so its figures are not final.
We never publish the names of individual donors, and anything we cannot source stays off the page. The methodology explains every such choice.