Funding profile
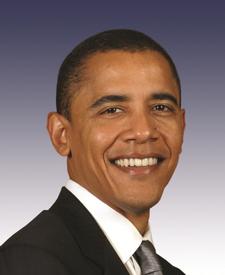
Barack Obama
Democrat · 44th President
Career totals · 2 elections · 2008–2012
<1%
of everything Obama has raised across 4 years, from 2008 to 2012 came from political action committees — organized groups rather than individual voters. That is $13,000 of $1.52 billion raised in all.
These are career totals — the sum of the 2elections listed further down, each of which links to the Commission’s own page where the figure matches line for line. See Obama on FEC.gov
Where the money came from
Everything Obama’s campaigns have reported raising, combined across every election.
- Individual donorsMoney given by people, in their own name.80%$1.21 billion
- Political action committeesOrganized groups: company-run committees, unions, trade associations.<1%$13,000
- Other sourcesParty transfers, the candidate's own money, loans and smaller categories.20%$307 million
Money spent about this member
Outside groups may spend without limit for or against a candidate, provided they do not coordinate with the campaign. This money never appears in Obama’s own filings, and Obama has no legal control over it.
This is not a donation. Nobody gave this money to Obama. Outside groups spent it on advertising for or against Obama across their elections. We report it separately from campaign funding because the law treats it separately — and because a group spending against a candidate is plainly not funding them.
$357.9 million
has been spent for or against Obama by outside groups. $23.4 million supported Obama; $334.5 million opposed Obama.
Largest outside spenders
Summed across 1 election, using the Commission's aggregated totals so amended filings and 24-hour notices are not double-counted.
- Spent againstRESTORE OUR FUTURE, INC.$88.6 million
- Spent againstAMERICAN CROSSROADS$84.5 million
- Spent againstREPUBLICAN NATIONAL COMMITTEE$41.1 million
- Spent againstAMERICANS FOR PROSPERITY$33.5 million
- Spent againstCROSSROADS GRASSROOTS POLICY STRATEGIES$15.3 million
- Spent againstAMERICANS FOR JOB SECURITY$15.2 million
- Spent againstNATIONAL RIFLE ASSOCIATION OF AMERICA POLITICAL VICTORY FUND$7.6 million
- Spent againstAMERICAN FUTURE FUND$7.5 million
Election by election
The career figures above are the sum of these. Each links to the Commission’s page for that election.
What is not published yet
We would rather show less than show something unsourced.
Industry-by-industry breakdowns, named individual donors, and how this member’s votes align with the groups funding them are all planned. They are absent because we have not verified them, and a funding profile is only worth reading if every line on it has been checked. Our methodology explains what we verify before publishing.